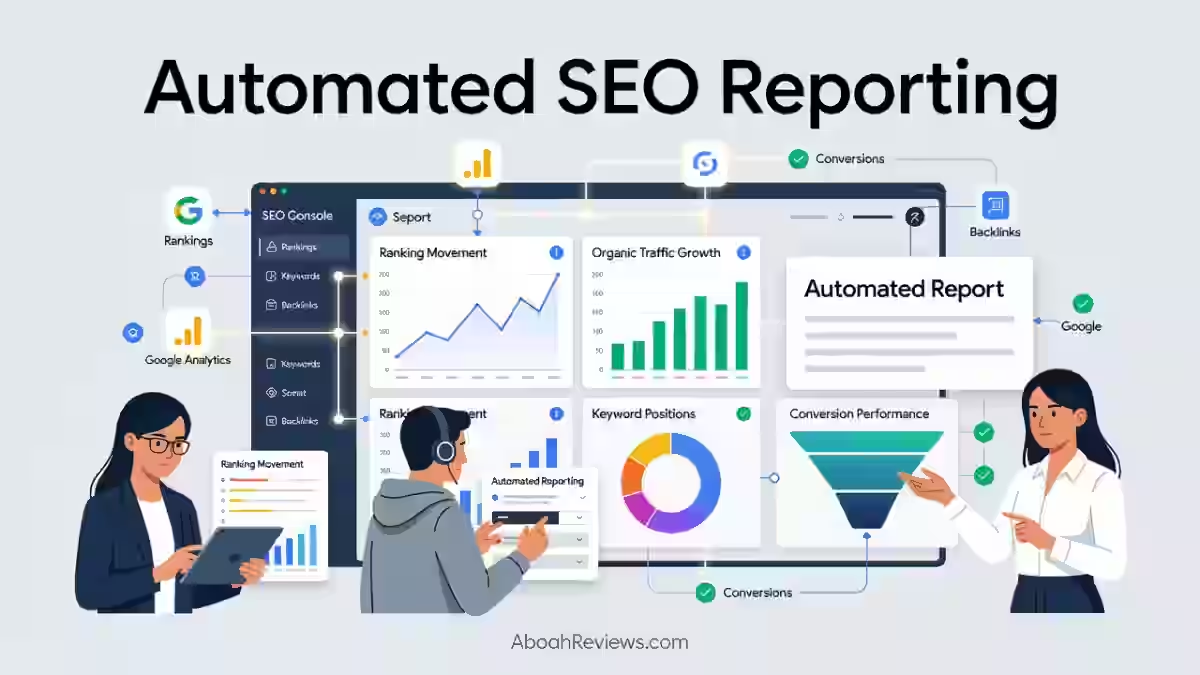
TL;DR: Automated SEO reporting is the process of using software to pull, organize, update and deliver SEO data (rankings, traffic, backlinks, technical issues) on a regular schedule without manual data entry.
How Automated SEO Reports Work
- Data Connection: Software links directly to platforms like Google Search Console, Google Analytics 4 (GA4) and rank trackers.
- Scheduled Refresh: The system updates numbers automatically as fresh metrics become available daily, weekly, or monthly.
- Delivery: Finished reports go straight to your email or client inboxes as a branded PDF, live dashboard link or presentation.
Key Metrics to Include
- Organic Traffic: Total visitors and trends coming from search engines.
- Keyword Rankings: Positions and movement for your target search queries.
- Technical Health: Page speed scores, broken links, and Core Web Vitals.
- Backlinks: Total external links and referring domains.
Popular Tools for Automation
- All-in-One Platforms: Tools like SE Ranking and SEOcrawl build, brand, and schedule recurring updates.
- Dashboard Builders: Google Looker Studio provides free, customizable visual templates.
- Agency Solutions: Platforms like Agency Dashboard manage white-label reporting for multiple clients at once.
The main takeaway: automation should handle data collection and delivery, but a human still needs to decide what the numbers mean.
Introduction
If you’ve ever spent three hours rebuilding the same monthly SEO report from scratch, pulling data from Google Search Console, then GA4, then your rank tracker, then copying everything into a slide deck only to repeat the whole process next month, you already know why automated SEO reporting exists.
This guide explains what automated SEO reporting actually is, how the process works behind the scenes, which metrics matter, and where I’ve seen teams (including me) mess it up.
By the end, you’ll know exactly what to automate, what to keep human, and how to build a reporting system that actually helps you make decisions instead of just looking busy.
What Is Automated SEO Reporting?
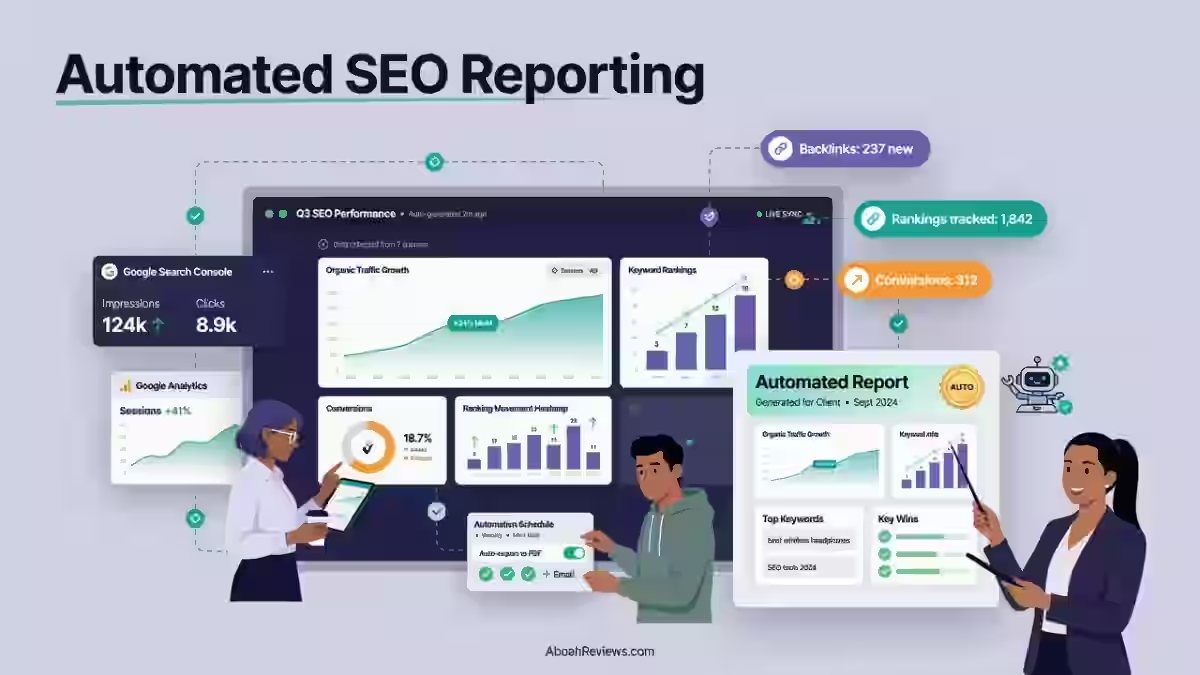
Automated SEO reporting is a system where software connects to your SEO data sources, such as Google Search Console, Google Analytics, and rank trackers, then pulls that data on a schedule and turns it into dashboards or reports without someone manually exporting numbers each time.
Manual SEO reporting, by contrast, means someone logs into each platform, exports CSVs, pastes them into a spreadsheet or slide deck, and formats it by hand.
I did this for about a year before switching to automated dashboards, and the difference in time saved alone was worth it.
Here’s the basic idea: reporting software connects to your data sources through APIs, consolidates the numbers into one place, and either builds a live dashboard you can check anytime or sends a scheduled report to your inbox on a set day.
Some tools also send automated alerts the moment something unusual happens, like a big traffic drop, instead of waiting for the next scheduled report.
A dashboard is something you check whenever you want. A recurring report gets pushed to you or your client on a fixed schedule, whether you open it that day or not.
None of this replaces actual SEO analysis. Automation can tell you that organic traffic dropped 18% last week. It can’t tell you why, or what to do about it, without a person looking at the data and connecting it to what changed on the site or in the SERP.
Automated SEO Reporting vs. Manual SEO Reporting
Automated SEO reporting wins on speed and consistency, while manual SEO reporting still has an edge in flexibility for one-off, custom analysis.
Here’s how the two stack up across the areas that actually matter day to day.
Factor | Automated Reporting | Manual Reporting |
|---|---|---|
Data collection | Pulled automatically via API | Exported by hand from each tool |
Report creation | Built from templates, minutes | Built manually, 1-4 hours per report |
Frequency | Daily, weekly, monthly, on demand | Usually monthly at most |
Human effort | Low after setup | High every cycle |
Consistency | Same format every time | Varies by who builds it |
Error risk | Lower (fewer manual entry mistakes) | Higher (copy-paste errors) |
Scalability | Works across 10 or 100 clients | Breaks down past a few accounts |
Analysis quality | Requires a human layer on top | Built into the process, but slower |
What Can and Can’t Be Automated?
Data collection, rank tracking, traffic reporting, technical audits, backlink monitoring, and scheduled alerts can all be automated with the right stack.
What can’t be automated is the judgment part: deciding what your SEO strategy should be, interpreting search intent behind a keyword, prioritizing which fix matters most this week, and turning a number into a business recommendation.
Here’s a quick breakdown:
Can be automated:
- Pulling data from Google Search Console, GA4, and rank trackers
- Rank tracking across hundreds or thousands of keywords
- Organic traffic reporting by page, device, or country
- Technical SEO audits (crawl errors, broken links, indexing issues)
- Backlink and referring domain monitoring
- Scheduled dashboards and recurring email reports
- Threshold-based alerts (e.g., traffic drops more than 20%)
- Basic AI-generated summaries of what changed
Still needs a human:
- Deciding overall SEO strategy and priorities
- Interpreting what a keyword’s search intent actually is
- Choosing which content to update, cut, or expand
- Ranking which issues to fix first when budget is limited
- Reading competitor moves and deciding how to respond
- Turning SEO data into a recommendation a business owner can act on
How Does Automated SEO Reporting Work?
Automated SEO reporting works through a chain:
- data sources connect via API to a reporting tool
- the tool processes and normalizes the numbers
- builds a dashboard or report
- delivers it on a schedule
- a person analyzes it and decides on the next SEO action
Skipping that last step is the single biggest mistake I see teams make and I’ll get into why later.
1. Connect Your SEO Data Sources
The first step is linking every platform that holds a piece of your SEO picture.
That typically includes:
- Google Search Console for search performance
- Google Analytics 4 for behavior and conversions
- a rank tracker for keyword rankings
- an SEO crawler for technical SEO issues
- a backlink database for link data
- Google Business Profile if you serve local customers
- sometimes a CRM or sales platform if you need to trace organic traffic all the way to revenue
2. Collect and Normalize the Data
This is where discrepancies show up, and if you’ve never compared GA4 traffic to GSC clicks, you’re in for a surprise.
Different platforms use different attribution models, update on different schedules, and sometimes define the same word differently.
Google Search Console counts a “click,” Ahrefs estimates traffic using modeled click-through-rate curves rather than real user data, and GA4 applies session-based attribution that can undercount visits blocked by ad blockers or cookie consent tools.
Time zones matter too. GSC data is generally reported in Pacific Time, while your GA4 property might be set to your local time zone, which can shift daily numbers by a few hours in either direction.
API rate limits and sampling on high-traffic properties add another layer of variance. None of this means the tools are broken. It just means you need to pick one source of truth per metric and stick with it.
3. Build the Dashboard or Report
Once the data is flowing in cleanly, you build the actual report structure.
This means picking your core SEO KPIs, adding filters for date ranges and segments (device, country, page type), and setting up comparisons like month-over-month or year-over-year.
A dashboard built for a CEO should look nothing like one built for a content strategist. The executive view needs three or four headline numbers and a trend line.
The specialist view needs query-level detail, page-level breakdowns, and enough granularity to actually plan next week’s work.
4. Schedule Reports and Alerts
Most teams run a mix of cadences rather than one fixed schedule.
Daily monitoring catches technical fires early, weekly reports track short-term movement, monthly reports go to clients and stakeholders, and quarterly reviews step back to look at strategy.
On top of the calendar-based reports, threshold alerts (like a 25% traffic drop) and anomaly alerts (unusual spikes or drops that don’t match historical patterns) catch problems between scheduled check-ins.
Which SEO Metrics Should You Include in an Automated Report?
Track metrics that connect SEO activity to business outcomes, not metrics simply because your tool happens to display them.
1. Organic Traffic
Organic traffic tells you how many people found your site through unpaid search results, and it’s the metric most people check first.
Look at organic sessions and users, the trend over time, new versus returning visitors, and which landing pages are pulling the weight.
Break it down by country or device only when it explains something, like a mobile-specific Core Web Vitals problem.
Always compare periods (week-over-week, month-over-month) rather than looking at a single number in isolation.
2. Keyword Rankings
Keyword rankings show where your pages sit in the search results for the terms you’re targeting, and the goal is tracking movement, not just position.
Track average position, movement on your priority keywords specifically, how many keywords sit in each ranking bucket (1-3, 4-10, 11-20), how many are on page one, and which keywords are entering or falling out of the top 10.
Separate branded and non-branded keyword rankings, because branded terms tend to be stable and can mask real changes happening in your non-branded visibility.
3. Google Search Console Performance
Google Search Console performance data covers impressions, clicks, click-through rate, average position, and the actual queries and pages driving traffic.
Looking at any one of these numbers alone can mislead you.
A page can gain impressions while losing clicks if a competitor’s snippet gets more compelling, or CTR can rise while total clicks fall if impressions dropped from a ranking loss.
Put the three together and you get the real story. High impressions with low CTR usually points to a weak title tag or meta description.
Rising average position with flat clicks might mean the query volume itself is shrinking.
This gets more relevant every quarter, since Ahrefs found a 34.5% drop in position 1 CTR when AI Overviews were present, based on an analysis of 300,000 keywords, which means position alone tells you less than it used to.
4. Organic Conversions and Revenue
Organic conversions and revenue measure whether your SEO traffic actually turns into leads, sales, or sign-ups, and this is the section most reports skip.
Track form submissions, purchases, sign-ups, conversion rate by landing page, and where possible, assisted conversions where organic search played a supporting role earlier in the journey.
Traffic alone doesn’t prove SEO is working.
I’ve sat in meetings where a client was thrilled about a 40% traffic increase, only for us to find out conversions had actually dropped because the new traffic was hitting informational pages with no path to a sale.
5. Technical SEO Health
Technical SEO health covers the site issues that can quietly choke your rankings even when your content is solid.
This includes crawl errors, broken links, indexing problems, canonical tag conflicts, redirect chains, Core Web Vitals scores, XML sitemap issues, robots.txt blocks, and structured data errors.
An automated crawler can flag most of these on a schedule, but someone still needs to decide which ones are worth fixing this sprint versus next quarter.
6. Backlinks and Referring Domains
Backlinks and referring domains show how much of the web is vouching for your site, and tracking the trend matters more than any single snapshot.
Monitor new links, lost links, total referring domains, the quality of those links (not just the count), how fast you’re gaining links relative to competitors, and what your competitors are picking up that you’re not.
A spike in low-quality links can look good on a chart and mean nothing for rankings, so context matters here more than most metrics.
7. Content Performance
Content performance tracking shows which pages are winning, which are fading, and which ones need attention before they slide further.
Watch your top organic landing pages, pages gaining or losing traffic month over month, signs of content decay (steady traffic decline over several months).
Pages actually driving conversions, and pages with high impressions but low CTR that might just need a better title.
8. Competitor Visibility
Competitor visibility tracking shows how your organic footprint compares to the sites fighting you for the same rankings.
Track shared keywords, who’s gaining or losing position on those terms, overall visibility share, how fast competitors are publishing new content, and which new keywords they’re winning that you haven’t touched yet.
This section works best as a monthly or quarterly check rather than something you obsess over weekly, since competitor rankings shift constantly and most of that noise doesn’t matter.
How to Choose the Right SEO KPIs for Your Business
The metrics that matter for a SaaS company are almost useless for a local plumber, and generic “track everything” advice ignores that completely.
Pick KPIs based on how your business actually makes money from organic search.
SaaS Companies
SaaS companies should center reporting on organic sign-ups, demo requests, and pipeline, not just traffic.
Track:
- organic sign-ups
- demo request volume
- traffic to core product pages
- rankings on non-branded
- problem-aware keywords
- marketing-qualified and sales-qualified leads from organic
- organic-assisted revenue where your CRM allows attribution
E-commerce Websites
E-commerce reporting should tie directly to transactions and revenue, not just sessions.
Track organic traffic to product and category pages, actual transactions, revenue by landing page, organic conversion rate, and product visibility for your highest-margin items.
Local Businesses
Local business reporting needs to reflect real-world actions, not just website visits.
Track local pack rankings, Google Business Profile visibility (views, searches, actions), phone calls, direction requests, website visits from the profile, and conversions on location-specific landing pages.
Publishers and Blogs
Publisher reporting should focus on content health and discoverability, since that’s the whole business model.
Track organic sessions, top-performing articles, content decay across your archive, search impressions, CTR trends, new keyword visibility, and revenue per page if you monetize through ads or affiliates.
SEO Agencies
Agency reporting needs to prove value across every client account without drowning anyone in noise.
Track client traffic and rankings, conversions, technical issues found and resolved, content performance, link acquisition, completed SEO actions for the month, and progress against the goals you actually agreed on at the start of the engagement.
What Tools and Data Sources Do You Need?
You need at minimum a search data source, a behavior/conversion data source, a rank tracker or SEO platform, and something to pull it all together into one view.
Here’s what each piece actually contributes.
Google Search Console
Google Search Console gives you Google’s own view of impressions, clicks, CTR, and average position by query and page, straight from the source.
What it doesn’t give you is user behavior after the click, conversion data, or backlink data, which is why it needs to be paired with other tools rather than used alone.
Google Analytics 4
Google Analytics 4 fills the gap Search Console leaves, showing what users do once they land on your site, including conversions, engagement time, and paths through the funnel.
It’s essential for tying organic sessions to actual business outcomes like form fills or purchases.
SEO Platforms and Rank Trackers
SEO platforms and rank trackers handle the parts Google’s own tools don’t cover: keyword rank tracking at scale, competitor analysis, backlink monitoring, and automated site audits.
Ahrefs, Semrush, and similar platforms pull this together, and Semrush notes it analyzes over 200 million domains and 26 billion keywords as part of its data set.
These platforms are where most of your visibility and backlink data will come from since Google doesn’t expose that information directly.
Looker Studio and Dashboard Platforms
Looker Studio and similar dashboard platforms pull data from multiple sources (GSC, GA4, Semrush, Ahrefs, spreadsheets) into a single visual report you can share or automate.
This is usually the layer that turns disconnected tool exports into one coherent view your team or client actually looks at.
CRM and Revenue Data
Connecting your CRM or sales platform to your SEO reporting is what finally answers the question every stakeholder actually cares about: did SEO generate real business?
Without this connection, you’re stuck reporting traffic and rankings and hoping people trust that it matters.
With it, you can show that organic search generated 40 qualified leads last month and trace a chunk of them to closed revenue.
How to Automate SEO Reporting Step by Step
Step 1: Define the Business Goal
Start with what the business actually needs, not with which metrics are easy to pull.
Is the goal more revenue, more leads, more brand visibility, more raw traffic, or expansion into a new market?
Everything else in your report should trace back to this answer.
Step 2: Identify the KPIs
Pick only the metrics directly tied to that goal, and resist the urge to add “just in case” numbers.
A revenue goal points you toward organic conversions and revenue by page.
A visibility goal points you toward rankings and impressions.
Step 3: Connect Your Data Sources
Link Google Search Console, GA4, your rank tracker, your SEO crawler, your backlink tool, and your CRM if revenue attribution matters.
Most modern platforms connect through native integrations or APIs, so this step usually takes an afternoon, not a week.
Step 4: Create Your Reporting Dashboard
Build sections for visibility, traffic, conversions, technical health, and content performance, with clear filters for date range and segment.
Keep the layout consistent across reporting periods so trends are easy to spot at a glance.
Step 5: Add Period Comparisons
Week-over-week comparisons work best for catching short-term technical problems, month-over-month for regular performance tracking, and year-over-year for accounting for seasonality.
A retailer checking November traffic against October will see a spike that has nothing to do with SEO and everything to do with the holidays, which is exactly why year-over-year matters for seasonal businesses.
Step 6: Configure Automated Delivery
Set the frequency, the recipient list, the file format (PDF, live dashboard link, email summary), the reporting period, and any filters specific to that audience.
A client report and an internal specialist report should never be configured identically.
Step 7: Add Alerts
Set thresholds for the changes that actually require immediate action: traffic dropping by a set percentage, a priority keyword falling out of the top 10, a critical page becoming non-indexable, a sudden loss of backlinks, or a conversion rate drop.
These alerts are what let you catch a problem on a Tuesday instead of finding it in next month’s report.
Step 8: Turn Insights Into SEO Actions
This is the step automation can’t do for you, and skipping it is the most common failure I’ve seen.
The flow should be report, then insight, then diagnosis, then action, then measurement.
A dashboard showing a 20% traffic drop is not the finish line, it’s the starting point for figuring out what actually happened.
What Should an Automated SEO Report Look Like?
A good automated SEO report has five sections: an executive summary, a visibility overview, content performance, technical SEO, and conversions/revenue, ending with recommended next steps.
Here’s how I structure each one.
Executive Summary
The executive summary should answer “how did we do” in under 60 seconds of reading.
Include overall performance, the biggest win, the biggest loss, the top opportunity, and one or two recommended actions for the period ahead.
Visibility Overview
The visibility overview covers rankings, impressions, CTR, and organic traffic together, since none of them tell the full story alone.
This section shows whether the site is becoming more or less visible in search overall.
Content Performance
The content performance section shows your winning pages, your losing pages, signs of content decay, and pages with real potential that just need a push.
This is where you decide what to update, what to leave alone, and what to retire.
Technical SEO
The technical SEO section lists critical issues, anything new since the last report, what’s been resolved, and what’s still outstanding.
Keeping a running “resolved vs outstanding” count shows whether technical debt is actually shrinking over time.
Conversions and Revenue
This section connects organic search directly to business outcomes: leads, sales, sign-ups, and revenue attributable to organic traffic.
It’s the section that justifies the SEO budget more than any other part of the report.
Recommended Actions
Every report should close with a simple structure: what happened, why it happened, and what you’re doing next.
Skipping this turns your report into a static record instead of a working document.
How Often Should You Send Automated SEO Reports?
More frequent reporting doesn’t automatically mean better reporting, and checking daily numbers for metrics that naturally take weeks to move just creates noise and false alarms.
Match the frequency to how fast that particular metric actually changes.
Report Type | Suggested Frequency |
|---|---|
Critical technical alerts | Real time / as needed |
Rank monitoring | Daily or weekly |
Traffic monitoring | Weekly |
SEO performance | Monthly |
Client reporting | Monthly |
Strategic SEO review | Quarterly |
Rankings and traffic move slowly compared to something like a server outage, so checking them daily just adds anxiety without adding useful information.
Save daily checks for the things that genuinely need same-day attention, like a site going non-indexable.
Common Automated SEO Reporting Mistakes to Avoid
1. Tracking Too Many Metrics
Tracking too many metrics buries the numbers that actually matter under a pile of ones that don’t.
I’ve built reports with 20+ metrics that nobody read past the first page, because there was no clear signal in all that noise.
Cut it down to what ties directly to your business goal from Step 1.
2. Reporting Traffic Without Conversions
Reporting traffic without conversions treats an intermediate metric like it’s the final outcome, and it isn’t.
Traffic matters because of what it leads to, not because a bigger number looks good on a slide.
3. Using Vanity Metrics
Vanity metrics are numbers that look impressive but don’t change any decision, like total keywords ranked anywhere in the top 10.
Impressive-looking charts that don’t influence what you do next are just decoration.
4. Ignoring Comparisons
A single number without a comparison point tells you almost nothing.
“12,000 organic sessions” means something completely different depending on whether last month was 8,000 or 15,000, so every metric needs a “compared to what.”
5. Mixing Data Sources Without Explaining Differences
Mixing data sources without explaining differences confuses stakeholders and erodes trust in the whole report.
GSC clicks, GA4 sessions, and Ahrefs traffic estimates rarely match exactly, since the Organic traffic metric in Ahrefs is an estimation of how many clicks your target gets each month, based on ranking position, search volume, and estimated CTR for that position rather than actual measured visits.
Label which source each number comes from so nobody assumes it’s a discrepancy or an error.
6. Automating Reports but Not Actions
Automating the report but not the follow-up defeats the point of building the system in the first place.
The goal was always to free up time for analysis and action, not to remove the human step entirely.
7. Sending the Same Report to Everyone
Sending an identical report to an executive, an SEO specialist, and a client ignores that they need completely different levels of detail.
The executive wants three numbers and a trend. The specialist wants query-level breakdowns they can act on.
8. Failing to Check Data Quality
Automated reporting can process bad data just as efficiently as good data, and a broken tracking tag will happily report a wrong number every single week.
Google itself has acknowledged data delays and processing issues in Search Console before. The report updates daily, usually with a 1-2 day delay.
This is worth knowing before you panic over a dip that’s really just incomplete data.
Automated SEO Reporting for Agencies vs. In-House Teams
SEO Agency Reporting
Agency reporting needs to be client-friendly, white-labeled, and scalable across dozens of accounts without a full rebuild each time.
Focus on clear summaries a non-SEO client can understand, branded report templates, dashboards covering multiple client accounts, automated delivery on a fixed schedule, clear recommendations, and ROI framed in terms the client actually cares about.
In-House SEO Reporting
In-house reporting usually needs to speak to other departments, not just the SEO team.
Focus on organic growth trends, content performance, technical health, visibility on product or category pages, leads and revenue, and reporting that connects cleanly with sales, product, and marketing teams.
Enterprise SEO Reporting
Enterprise reporting adds complexity most smaller sites never deal with: multiple domains, subdomains, international SEO across languages and regions, and technical monitoring at a much larger scale.
This usually means separate department-level dashboards feeding into one executive summary, since a single flat report can’t represent a site with millions of pages across a dozen markets.
How AI Is Changing Automated SEO Reporting in 2026
AI-Generated SEO Summaries
AI can now turn raw numbers into plain-language explanations, saving the step of manually writing “here’s what changed this month.”
Instead of a chart with no context, you get a written summary flagging what moved and by how much, though it still needs a human check before it goes to a client.
Automated Anomaly Detection
Automated anomaly detection flags unusual traffic drops, ranking swings, conversion changes, or crawl issues that fall outside normal patterns, without waiting for a scheduled report.
This catches problems days or weeks before a monthly report would have surfaced them.
AI-Powered Recommendations
The difference between basic automation and useful automation shows up here.
A basic alert says “your traffic dropped 15%.” A better system says traffic dropped 15% because specific pages lost visibility for a specific cluster of queries, which gives you somewhere to actually start looking instead of a vague number to worry about.
SEO Reporting for AI Search Visibility
Reporting now needs to look past traditional Google rankings toward visibility inside AI Overviews, ChatGPT, Perplexity, and Gemini, since that traffic and exposure increasingly matters too.
This part of reporting is still far less standardized than click and ranking data.
AI Overviews were triggered for 6.49% of queries in January 2025, 24.61% in July, and 15.69% in November according to Semrush’s report.
This shows how much this shifts month to month rather than settling into a stable baseline.
Each AI platform measures visibility differently, some through citations, some through brand mentions, some through raw appearance rate.
So treat these numbers as directional rather than as apples-to-apples with your keyword rankings.
If you’re building out this side of reporting, my guide on generative engine automation breaks down what’s actually measurable right now versus what’s still guesswork.
How to Measure SEO ROI With Automated Reporting
Connect SEO Traffic to Conversions
Connecting SEO traffic to conversions means tagging and tracking which organic sessions actually lead to a form fill, sign-up, or sale.
Without this link, you’re reporting activity, not results.
Measure Organic Revenue
Measuring organic revenue means attributing actual dollar amounts, not just conversion counts, to your organic search channel.
E-commerce sites can usually do this directly through GA4’s e-commerce tracking; service businesses often need a CRM connection to close the loop.
Track Cost vs. Return
Tracking cost versus return means weighing what you spent (content production, agency fees, link-building, tools) against what organic search actually generated in leads or revenue.
A monthly SEO spend of 2,000 to 8,000 that generates 15,000 in attributable revenue tells a very different story than the same spend generating 3,000, and that comparison only works if your reporting connects the two sides.
Report SEO Progress to Executives
Reporting to executives means translating SEO language into business language, since most stakeholders don’t care about average position, they care about pipeline and revenue.
Swap “we improved rankings for 40 keywords” for “we generated 60 new qualified leads from organic search this quarter” whenever the data supports it.
How to Turn Automated SEO Reports Into Action
Every metric change should follow the same basic path: notice the change, diagnose the cause, identify which pages or queries are affected, prioritize the fix, implement it, then measure the result.
Here’s how that plays out with a few real patterns I’ve seen over and over:
- High impressions, low CTR → the page is showing up but nobody’s clicking, so check the title tag and meta description first.
- Traffic down, rankings stable → something outside your control changed, like seasonality, SERP layout, or a new AI Overview eating clicks.
- Rankings down, technical errors increased → look at crawl and indexing issues before touching content, since a technical problem can tank rankings on its own.
- Traffic up, conversions down → the new traffic likely doesn’t match the intent your page was built for, so revisit the content or the call to action.
This is also where content decay tracking earns its keep. I’ve watched pages that once ranked well slide quietly for months before anyone noticed, simply because nobody was checking that specific pattern.
Best Practices for Automated SEO Reporting
- Start with the business objective before picking a single metric.
- Track fewer, more meaningful SEO KPIs rather than everything available.
- Use consistent reporting periods so comparisons actually mean something.
- Build separate views for executives and specialists.
- Label every data source so discrepancies don’t look like errors.
- Automate the repetitive collection and delivery work.
- Keep a human analysis step in the workflow, always.
- Use alerts for anything urgent instead of waiting for the next scheduled report.
- Review your report quality every quarter, not just the data inside it.
- Tie SEO metrics to conversions wherever the data allows it.
If you’re scaling content production alongside your reporting, it’s worth reading up on AI SEO automation more broadly, since reporting is only half the system.
Final Takeaway
Automated SEO reporting isn’t simply about generating reports on autopilot.
It’s about building a repeatable system that collects reliable SEO data, flags what actually changed, and gives your team something to act on instead of just something to look at.
Automate the data collection. Automate the repetitive delivery. Keep strategy, prioritization, and judgment human-led, because that’s the part no dashboard has figured out how to do for you yet.
Adjust the frequency and depth of your reporting to fit your team size, whether that’s a solo freelancer checking a weekly dashboard or an agency running automated reports across 40 client accounts.
If you’ve run into your own reporting mistakes or found a setup that works well for your team, I’d genuinely like to hear about it.
Frequently Asked Questions About Automated SEO Reporting
What is the best automated SEO tool?
The best automated SEO tool depends on your primary goal. For an all-in-one platform handling research, scheduled audits, and rank tracking, Semrush is the industry leader. For technical audits, Screaming Frog SEO Spider is unmatched, while Surfer SEO excels at automated on-page content scoring.
What are the 5 best SEO tools?
The 5 best SEO tools are Semrush, Ahrefs, Google Search Console, Screaming Frog SEO Spider, and Surfer SEO
How to generate an SEO report?
To make an SEO report, define your core goals, gather data from Google Search Console and Google Analytics, and organize the metrics into a clear layout. Start with an executive summary, highlight traffic and rankings, explain the trends, and end with clear action steps.
What is the best tool for SEO reporting?
The best tool for SEO reporting depends on your needs, with Semrush serving as the top all-in-one platform for data and custom dashboards, and Google Looker Studio acting as the best free choice for visual reports.
Can ChatGPT do an SEO audit?
ChatGPT can analyze data and prioritize fixes for an SEO audit, but it cannot independently crawl a website or collect live technical metrics on its own.

- Automated SEO Reporting: How It Works, Tools & Best Practices (2026) - August 25, 2026
- Clearpost AI Review 2026: I Tested It for 30 Days & Found Some Limitations - August 19, 2026
- ProfitTree Review 2026: My 30-Day Test Results, Flaws & Verdict - August 18, 2026